A TV Rating of 5.0 Means 5 Percent of TV Homes Were Watching. Here's What Nielsen Actually Counts.
A rating's a percentage, not a headcount — 5.0 means 5 out of every 100 TV homes had the show on, the share counts only the sets that were on at all, and the demo rating swaps the denominator for people aged 18 to 49. Here's the machine, run small first.
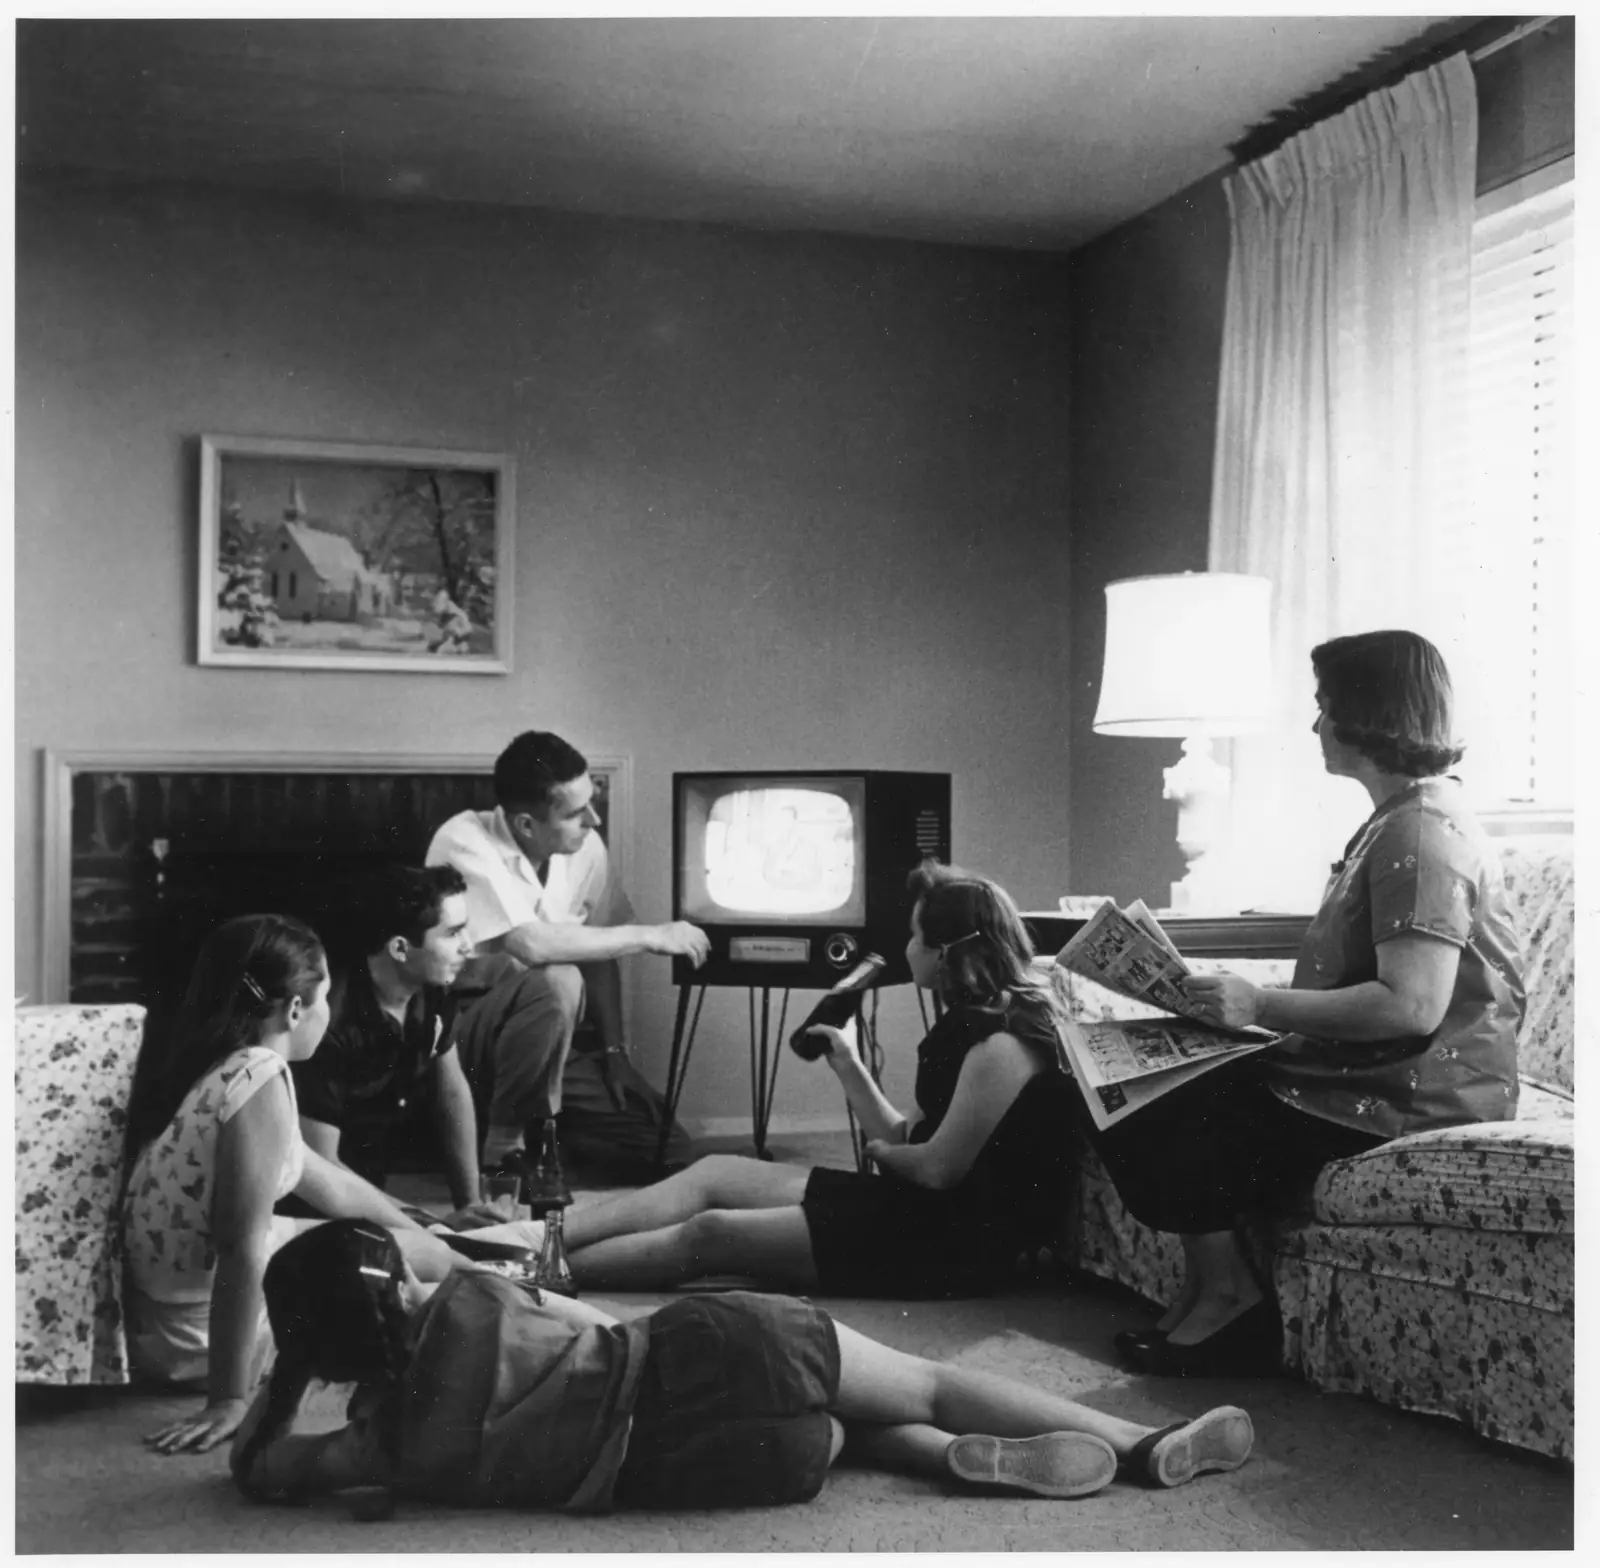
Say it the way most of us say it at the kitchen table: "It got a 5.0 rating — so, what, five million people watched?" That's the reader's wrong sentence, and it's wrong in a useful way. A Nielsen rating doesn't count people at all. It counts a share of a group — and once you know which group, the number turns back into plain English.
The short version: a rating's a percentage, and here's its denominator
- A rating is a percentage. A household rating of 5.0 means 5 out of every 100 TV homes watched the program — 5 percent of the whole TV-home population, sets on or off.
- A share is a smaller, hotter percentage. It counts only the homes with a set actually on at that hour, so a share's always bigger than the rating for the same show.
- A demo rating swaps homes for people. An adults 18–49 rating of 3.0 means 3 out of every 100 adults aged 18 to 49 watched — a different denominator, so it can't be compared straight against a household number.
- Nobody counts every home. Nielsen measures a panel — a sample of homes with meters — blends it with big data from sets and boxes, and projects the result onto the whole country.
- The window moves the number. Live+Same Day counts viewing on the day a show airs, playback included; Live+7 keeps counting for a week, so the same episode owns two different ratings, each answering a different question.
Watch it happen: 100 TV homes, one hour, one show
Here's the trick — shrink the country until it fits on one street. Picture 100 homes, every one of them with a TV. It's 8 p.m. In 40 of the 100 homes, a set's on. In 60, the TV's dark — dinner, homework, a walk, whatever. Of the 40 sets that are on, 5 are tuned to our show. The other 35 are watching something else.
Now do the arithmetic out loud, because both famous numbers fall out of those three piles.
The rating first. Five homes watched, out of 100 TV homes in total. Five divided by 100 is 5 percent. The rating is 5.0. One rating point equals one percent of the group being measured — that's all a point ever is.
The share second. Forget the 60 dark homes; they aren't in this fraction. Five homes watched, out of 40 homes with a set on. Five divided by 40 is 12.5 percent. The share is 12.5. Same show, same hour, same five sofas — two numbers, because the denominators differ. The rating tells you how far the show reached into the whole population. The share tells you how it did against the competition for the people who were watching anything at all. A late-night show can post a small rating and a fat share — few sets on, and it owns a big slice of them.
Homes aren't people: the 18–49 demo
Advertisers don't buy sofas; they buy people, and mostly people in one age band. So run the street again and count heads instead of homes. Say 200 adults aged 18 to 49 live in our 100 homes. Six of those 200 adults watched our show. Six divided by 200 is 3 percent. The adults 18–49 rating is 3.0 — for the very same broadcast that just scored a 5.0 household rating and a 12.5 share.
Neither number's broken. They're answers to different questions, with different denominators printed in their names: percent of TV homes, percent of sets in use, percent of adults 18–49. Nielsen's own explainer puts the buying habit plainly: the most widely used commercial metric, called C3, is typically figured for all adults 18–49, described there as a key buying group. That's why a trade headline can call a show a hit and a flop in the same week — it's quoting the household number and the demo number side by side, and the demo's the one the ad money follows.
The caveat rides inside the arithmetic, where it belongs: a percentage can't tell you a headcount until somebody hands you the size of the group it's a percentage of. A 5.0 in a group of 100 homes is five homes. The national version needs the national count of TV homes for that season, and that count changes over time — so a rating point this year and a rating point from a decade ago aren't the same number of living rooms, even when the digits match.
Who's actually counted: the panel
Nielsen doesn't wire the country. It measures a sample and projects. In Nielsen's own current description, ratings data is developed through a combination of panel data and big data — the panel supplies the people, the big data supplies the scale, and each covers the other's blind spot.
The panel is a set of recruited homes standing in for the viewing population. Its key instrument is Nielsen's people meter — a set-top device with a remote control, or a wearable device: a clip, a pendant, a wristband. The meter's job splits in two: detecting what's playing, and registering who's in front of the screen. Britannica's account of the system describes the same split from the other side: a meter attached to each television set records the channel being watched, and individual buttons record which person in each household is watching.
The what's-playing half runs on signals you can't hear. Nielsen's methodology page explains that broadcasters encode inaudible watermarks into a program's audio, meters in panel homes decode them — live or time-shifted — and where a watermark can't be detected, meter software builds an audio fingerprint on the fly and matches it against a reference library.
Here's the limit that rides with the method: a projected sample is an estimate wearing a suit. The honest way to hold a rating is as the industry's agreed estimate — the number everybody transacts on — rather than as a census of sofas.
The window moves the number: Live+Same Day and Live+7
One more dial, and it's the one that makes Monday's headlines quarrel with next week's. Nielsen lists the variations itself: a rating may be based on live viewing only, live plus same-day playback, live plus 3 days, live plus 7 days, or even live plus 35 days.
Live+Same Day counts the people who watched as the show aired, plus the people who played it back before the day was out. Live+7 keeps the door open for a full week of playback. Our street makes the gap visible: if two more of the 100 homes play the episode back on day four, the Live+Same Day rating stays 5.0 — those two homes missed its window — while the Live+7 household rating climbs to 7.0, seven of the 100 homes, because day four sits inside its window. Same episode, same street, two ratings, and the difference is a calendar, not an argument.
The trade runs on both clocks at once. Nielsen notes that buyers and sellers transact on average commercial-minute ratings — C3, which folds in live plus 3 days of playback, and C7, the same idea at 7 days — while the numbers casual readers meet first are usually the Live+Same Day figures, because they're the ones that exist the next morning. A show that "grew" between the first report and the later one didn't find new fans out of thin air; its fans watched on their own schedule, and the longer window finally counted them.
The test to take to the next ratings headline
So here's the test, and it fits on an index card. When a headline hands you a rating, ask three questions. Percentage of what — homes, sets in use, or adults 18–49? Counted by when — live, same day, or seven days later? And how big is the group underneath, this season? A number that survives those three questions is a fact. A number that can't is a costume.
If percentages wearing costumes are your kind of puzzle, our CinemaScore explainer (linked below) takes apart another famous number — a letter grade built from about 500 lobby ballots — and our Tomatometer piece does the same for the percentage that isn't a grade. Different instruments, same kitchen-table question: what's the denominator?
Sources
- Nielsen, "Need to Know: What are Nielsen ratings?" — ratings defined as the percentage of the TV-owning population that watched a program or commercial; the live / live+same day / live+3 / live+7 / live+35 variations; household and persons-level demographic ratings; ratings data developed through a combination of panel data and big data. https://www.nielsen.com/insights/2025/what-are-nielsen-ratings/ — opened in full 2026-11-06.
- Nielsen, "Need to Know: How are TV audiences measured?" — the people meter (set-top device with remote, or wearable clip, pendant or wristband); inaudible watermarks decoded in panel homes, live or time-shifted, with audio fingerprints as fallback; C3 as the most widely used commercial metric, live plus 3 days, typically for adults 18–49 as a key buying group, with C7 at 7 days; panel plus big data as the measurement model. https://develop.nielsen.com/insights/2023/how-to-measure-tv-audiences/ — opened in full 2026-11-06.
- Encyclopaedia Britannica, "Nielsen ratings" — the independent check: a meter attached to each television set records the channel being watched and sends the data to a computer centre; individual buttons record which person in each household is watching; a rating of 20 denotes 20 percent of households tuned in. https://www.britannica.com/art/Nielsen-ratings — opened in full 2026-11-06. Note: Britannica's panel-size figure reflects the early 21st century and isn't used in this piece; Nielsen's current pages don't state a panel size, so this piece doesn't print one.

 Next in this issue · The ExplainersA Platinum Album Isn't Counted Automatically. The Label Has to Ask, and Streams Count at 1,500 to One. →
THE MOTHER LODE — Edition Nº 004 · Late — Suite Picks. Photos are real, licensed and credited on the page; designed cards carry figures from the article itself.