Swap Netflix's Recommender for a Most-Popular List and Engagement Falls 12 Percent, by Netflix's Own Count
Netflix's recommendation system picks the rows, the order and even the artwork on its home screen. A 2025 study by Netflix's own researchers measured what the picking is worth: replace it with a plain most-popular list and engagement drops 12 percent.
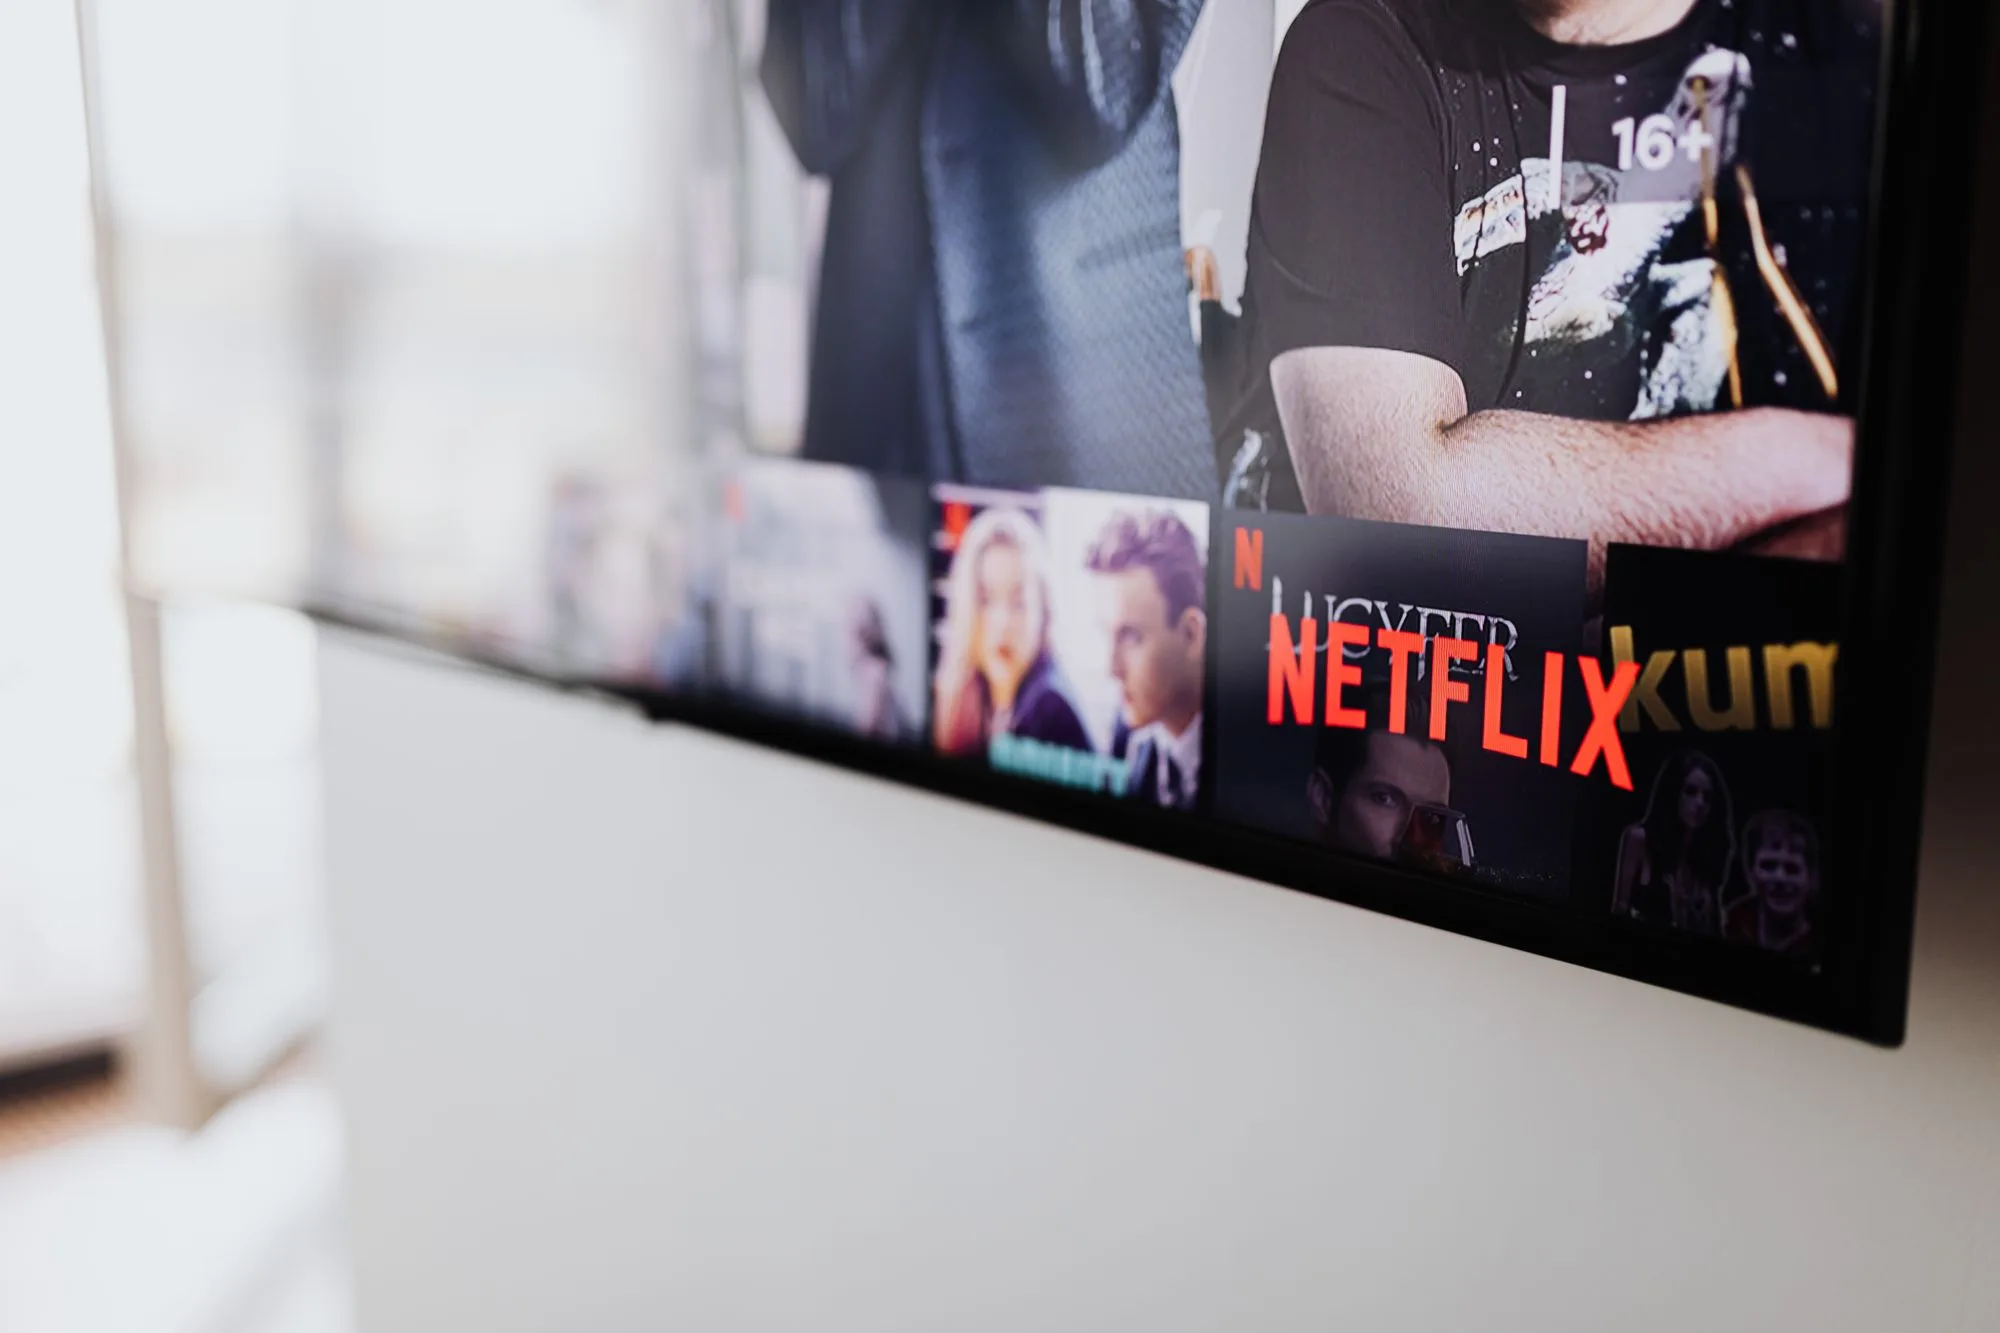
Netflix's home screen isn't a catalogue. It's a prediction, rebuilt per member: which rows appear, which titles sit in each row, in what order, and which artwork sells each title. The company has spent two decades arguing that the prediction is the product. What's newer is that its own researchers have priced the argument.
The test is simple to state. Take the current recommendation system away and hand members a most-popular list instead — the same titles for everyone, ranked by what the crowd watches. A 2025 study from Netflix Research measures the cost of that swap at 12 percent of engagement. Not 12 percent of one feature's clicks. Twelve percent of the thing the whole interface exists to produce.
The Inputs Are Behaviour, Not Demographics
Netflix's published explanation of the system lists what feeds it. Your viewing history and how you've rated what you watched. The behaviour of members whose tastes resemble yours. Information about the titles themselves — genre, category, cast, release year. And context: the time of day, the device you're on, how long you tend to watch.
One exclusion is stated just as plainly: the recommendations don't use demographic information such as age or gender. The system doesn't know you in the census sense. It knows what you did last Tuesday at 9 p.m., which is the more useful fact and, depending on your view, the more intimate one.
Those inputs drive more than a "because you watched" row. The same prediction decides the order of the rows themselves and the sequence inside each row — and it reaches the artwork. Netflix personalizes the image attached to a title, so the same film can present as a romance to one member and a thriller to another, because the frame most likely to earn that member's click differs. The poster isn't the film's poster anymore. It's a per-member sales pitch generated from the member's history.
The 80 Percent Figure Is the Company's, and It Has a Paper Trail
The most quoted number in this field — recommendations influence about 80 percent of hours streamed on Netflix, with the rest arriving through search — comes from a paper by two Netflix executives, Carlos Gomez-Uribe and Neil Hunt, published in ACM Transactions on Management Information Systems. It's the company's own figure, from the company's own system, printed here with that label attached.
Read it for what it measures. Hours streamed isn't satisfaction, and influence isn't proof the picks were good — a member who clicks the first row because it's first still counts. The figure establishes the system's reach: four-fifths of viewing passes through the recommender's choices. What the reach is worth took another decade and a different method to measure.
The 2025 Study Ran the Swap Test on Two Million Members
The newer paper — by Kevin Zielnicki of Netflix, Guy Aridor of Northwestern's Kellogg School, and co-authors at Netflix and Cornell — models viewing for two million Netflix members across the roughly 7,000 titles in the U.S. catalogue, and asks what happens under different recommendation policies. The answers, in the paper's own comparisons: swap the current system for a popularity-based one and engagement falls 12 percent. Swap in a traditional matrix-factorization recommender — the class of system Netflix itself ran a decade ago — and engagement falls 4 percent. Hand members effectively random recommendations and engagement falls 16 percent.
Translate the headline number into a bench scale. For every 100 units of engagement the current system produces, the most-popular list produces 88 — with the identical catalogue, the identical members and the identical prices. The only variable is the ordering intelligence. The study also reports where the value sits: most of the gain comes from targeting — matching the right title to the right member — rather than from mere exposure, and the largest gains land on mid-popularity titles, the ones a crowd-ranked list buries and a pure niche feed can't sustain.
Two cautions belong in the same breath, and the paper's framing supports both. It's research, published to be read — it isn't a product announcement, and nothing about the live service changed because it appeared. And the measurement is the company's, run on the company's data, by authors several of whom hold a financial stake in Netflix — a disclosure the paper itself prints. The figure is the best public evidence available on the question. It isn't an independent audit.
The Company Has Been Buying This Idea Since the Prize
The through-line is old. Netflix ran the Netflix Prize from 2006 to 2009 — a million dollars for any team that could beat its rating predictions by 10 percent — and its researchers published the competition's account themselves. The winning system was never fully put into production; the engineering cost outweighed the gain, a detail the company's own retellings keep, to their credit.
That history is the honest frame for the 2025 result. The recommender isn't a feature bolted onto a video store. It's the line item Netflix has been funding, measuring and publishing about for twenty years, through the DVD queue, the star ratings, the rows and now the artwork. The study's contribution is a price tag: strip the targeting out, keep everything else, and about an eighth of the engagement goes with it. Announced, promised and shipped are different facts — but the research record here is unusually consistent, and it all points the same direction.
Sources
Gomez-Uribe & Hunt, "The Netflix Recommender System: Algorithms, Business Value, and Innovation," ACM Transactions on Management Information Systems (Netflix Research) — the roughly 80 percent of hours streamed figure, the system's scope · Zielnicki, Aridor et al., "The Value of Personalized Recommendations: Evidence from Netflix" (Netflix Research, December 2025) — two million users, roughly 7,000 U.S. titles, the 12 / 4 / 16 percent counterfactuals, targeting over exposure, mid-popularity gains. https://arxiv.org/html/2511.07280v4 · Netflix's published explanation of how its recommendations work — the input set, the age-and-gender exclusion, personalized rows, order and artwork.
 Next in this issue · OpinionI'm Paying Full Price for 81 Percent of a Retirement →
THE MOTHER LODE — Edition Nº 004 · Late. Photos are real, licensed and credited on the page; designed cards carry figures from the article itself.